What is a fair price per square foot for a Brentwood home right now? If you have been comparing Brentwood to Bel Air and Pacific Palisades, you have probably seen different numbers from different sites. You want a clear, defensible benchmark so you can price, negotiate, or plan with confidence. Below, you will find practical PPSF ranges, why the numbers vary, and a simple method you can use for apples‑to‑apples comparisons. Let’s dive in.
Price per square foot at a glance
- Brentwood: about $900–$1,300 per sqft for mid‑2025 using recent closed sales of single‑family homes. Directional portals support this range, such as Redfin’s Brentwood median sold PPSF and Realtor.com’s Brentwood listing PPSF snapshots.
- Pacific Palisades: about $950–$1,500 per sqft. Listing snapshots often show higher figures for coastal pockets, as seen in Realtor.com’s Pacific Palisades overview.
- Bel Air: about $900–$1,600 per sqft, with the widest swings due to trophy estates and small sample sizes. See the contrast between Realtor.com’s Bel Air overview and monthly sold snapshots on Redfin’s Bel Air market page for context.
These are ranges, not list prices for a specific address. Each neighborhood has everyday family homes and a smaller set of trophy properties that push averages around.
Why numbers vary by source
- Some portals quote list price per sqft while others quote sold price per sqft. Sold data is a better indicator of what buyers actually paid. For example, Redfin reports median sold PPSF while Realtor.com often shows listing PPSF.
- Portals may include condos and townhomes unless you filter for single‑family homes. Mixed property types skew PPSF.
- The lookback window matters. Twelve months smooths volatility in low‑transaction luxury pockets. One month can swing sharply, especially in Bel Air.
- Indexes like Zillow’s Brentwood value trends offer useful context but are not direct PPSF from closed single‑family comps.
The method: a defensible Brentwood benchmark
Use this simple, defensible approach for your own PPSF baseline:
- Metric: median sold price per sqft. Avoid list PPSF for valuation decisions.
- Property type: single‑family homes only. Exclude condos and multifamily.
- Lookback: last 12 months to improve sample size and reduce seasonality.
- Outliers: trim obvious outliers, such as mega‑mansions and tiny teardown lots, or place them in a separate “trophy” band.
- Label clearly: “Median sold PPSF, single‑family, last 12 months,” with the source and month noted.
Neighborhood context that shifts PPSF
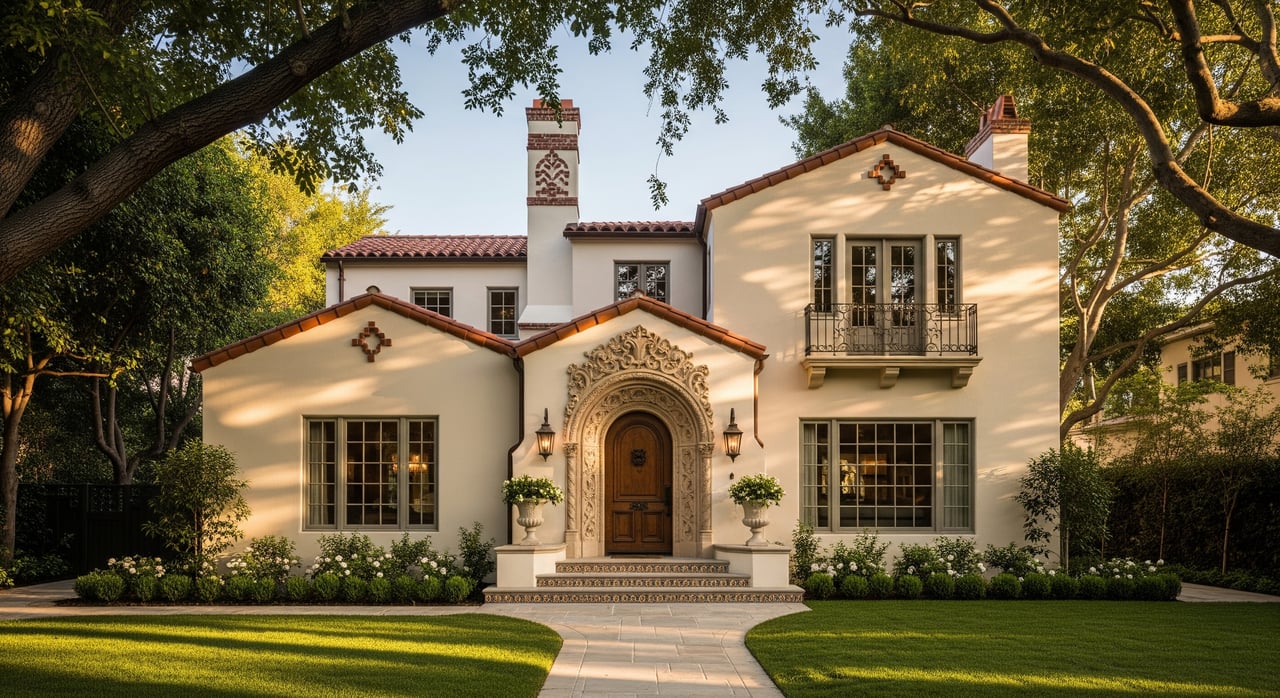
Brentwood: balanced mix and submarkets
Brentwood’s diversity helps stabilize PPSF. The area includes Brentwood Park, Brentwood Village/Flats, Mandeville Canyon, and Sullivan Canyon, each with different lot profiles and architecture. Subareas like the Flats and Village often price differently than canyon estates. For a quick primer on local geography, see Brentwood’s subareas.
Pacific Palisades: coastal premiums and recent events
Bluff and ocean‑view properties often command higher PPSF than inland village sections. Recent wildfire activity in the broader region has influenced inventory and rebuild decisions, which can affect short‑term PPSF readings. See reporting on recent wildfire impacts in the region and pricing context from Realtor.com’s Pacific Palisades overview.
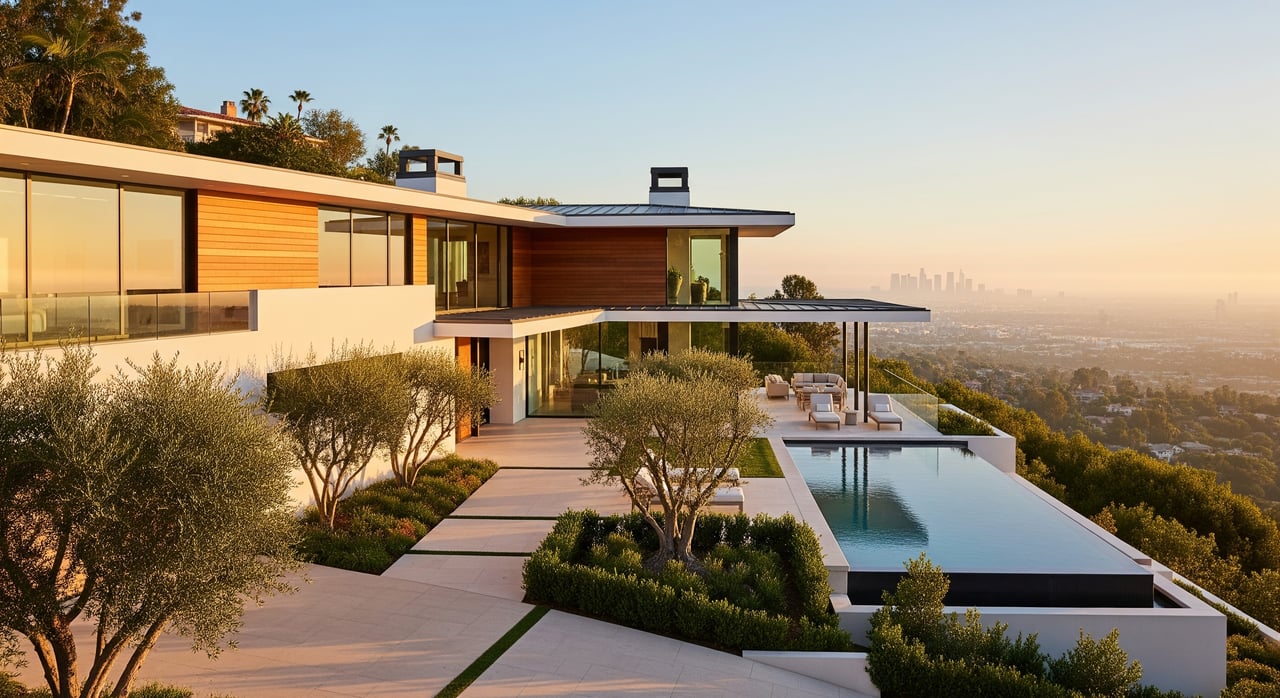
Bel Air: trophy skew and volatility
Bel Air has many large estates on large lots and fewer transactions. A single mega sale or a large teardown can move monthly medians. Portals often show higher listing PPSF, yet sold snapshots can read much lower in a given month due to sample size. Compare Realtor.com’s Bel Air overview with Redfin’s Bel Air market page to see the swings.
Everyday vs trophy: set two benchmarks
Create two working bands so you do not mix incomparable properties:
- Everyday benchmark: median sold PPSF for single‑family homes, last 12 months. This is your primary pricing guide for most family homes in Brentwood, typically in the $900–$1,300 per sqft range based on recent closed sales.
- Trophy benchmark: median or listing PPSF for the top 5 to 10 percent of properties. These homes often present unique architecture, extraordinary privacy, or view lots and can push into the top‑end of the ranges shown above, especially in Bel Air and the Palisades where listing PPSF often runs higher in snapshots like Realtor.com’s Bel Air overview.
How to use these ranges for your decision
Use PPSF as a starting point, then adjust for features that materially change value:
- Split Brentwood into submarkets. Compare Flats and Village addresses to each other, and analyze canyon estates as a separate set.
- Prioritize sold comps from the last 6 to 12 months. Cross‑check with Redfin’s Brentwood median sold PPSF for directional sanity.
- Annotate key value drivers. Ocean or canyon views, lot size and utility, remodel level, pool, and ADU can shift PPSF significantly.
- Identify outliers early. Teardowns on large lots and very large estates should sit in a separate trophy band to avoid skewing your baseline.
- Use portal listing PPSF for color only. Listing PPSF tends to read higher than what sells in many snapshots. Keep your core benchmark rooted in sold data.
If you want a precise, address‑level PPSF with curated comps and a strategy for value, connect with Giuseppe Talarico for a discreet, design‑driven assessment tailored to your goals.
FAQs
Which PPSF number should I trust when pricing a Brentwood home?
- Trust the median sold price per sqft for single‑family homes over a 12‑month window, and label the source and date, such as a snapshot from Redfin’s Brentwood page.
Why do websites show different PPSF for the same neighborhood?
- Differences come from list vs sold prices, mixed property types, small sample sizes, and different time windows, as seen when comparing Realtor.com’s Brentwood overview with sold data snapshots.
How much do views or lot size change PPSF in the Palisades?
- The impact can be substantial, especially for bluff or ocean‑view properties reported in Realtor.com’s Pacific Palisades overview, so adjust comps for views, lot utility, remodel level, pool, and ADU rather than using a single percentage.
Should I publish one PPSF number for Brentwood?
- If you do, label it clearly as “median sold PPSF, single‑family, last 12 months,” and consider adding a separate trophy band to reflect submarket differences like Flats versus Mandeville Canyon noted in Brentwood’s subareas.